

Imagine spending millions of dollars on a generic drug trial, only to have the regulatory agency reject it because you recruited too few volunteers. Or worse, recruiting hundreds of people when fifty would have done the job, wasting time and money while exposing unnecessary subjects to risk. This is the high-stakes reality of bioequivalence (BE) studies, which are clinical trials designed to prove that a generic drug performs just as well as its brand-name counterpart. The difference between success and failure often comes down to two statistical concepts: power and sample size. Get these wrong, and your study fails. Get them right, and you secure approval efficiently.
The Core Problem: Why Sample Size Matters More Than You Think
In most clinical trials, bigger is better. In bioequivalence, bigger is only better up to a point, and sometimes, bigger is actually problematic. Unlike superiority trials that look for any difference, BE studies look for no significant difference. You are trying to fit the test drug’s performance inside a specific window compared to the reference drug. If your sample size is too small, you might miss this equivalence even if the drugs are truly similar (a Type II error). If it’s too large, you waste resources and may detect trivial differences that aren’t clinically relevant.
The goal is precision. You need enough data to confidently say the geometric mean ratio (GMR) of the test to reference product falls within the accepted limits-usually 80% to 125%. But how many people do you need? The answer depends entirely on the variability of the drug in the human body and the statistical power you aim for.
Understanding Statistical Power in BE Trials
Statistical power is the probability that your study will correctly demonstrate bioequivalence if the drugs are indeed equivalent. It is calculated as 1 minus beta (β), where beta is the chance of a false negative. Regulatory agencies like the FDA and EMA typically require a power of at least 80%, though 90% is the standard for many submissions, especially for narrow therapeutic index drugs.
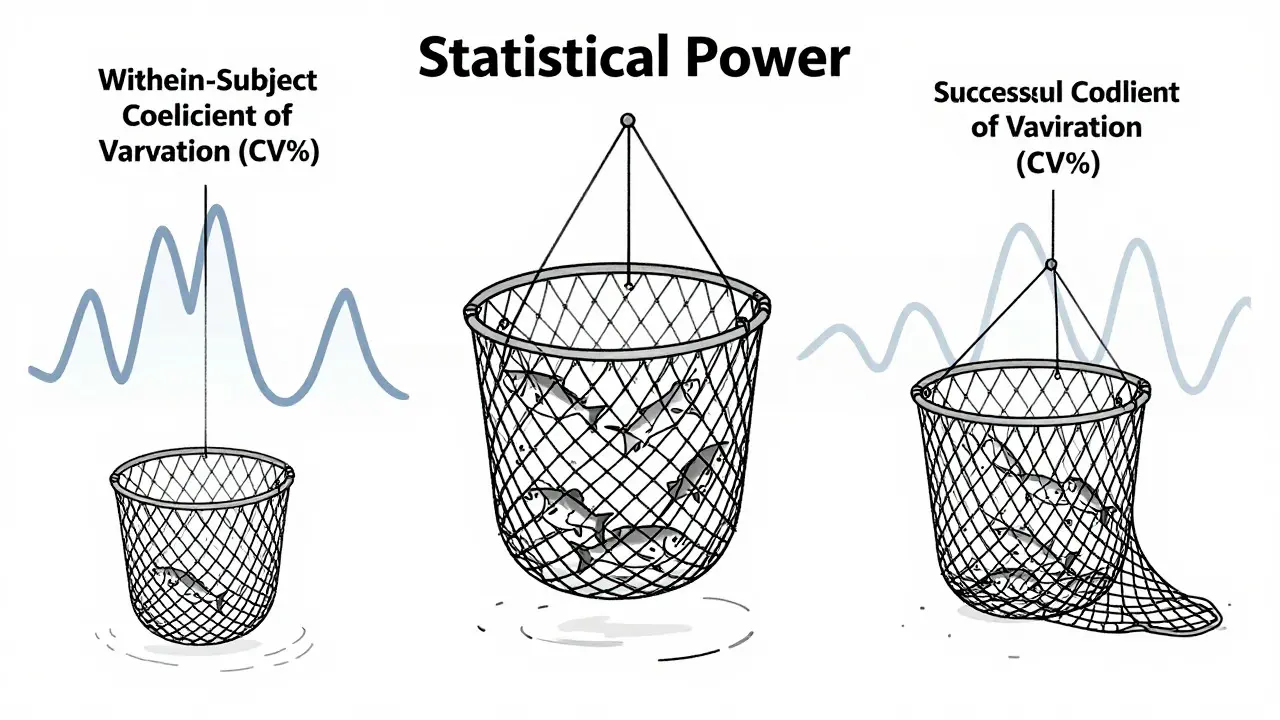
Think of power as the sensitivity of your net. An 80% power means that if you run this exact study ten times with equivalent drugs, you’ll get a passing result eight times. A 90% power raises that to nine out of ten. Why does this matter? Because an underpowered study is a gamble. Dr. Donald Schuirmann, a leading expert in BE methodology, notes that underpowered studies are among the most common reasons for failure in generic drug development. These failures don’t just delay launch; they force companies to repeat entire trials, costing millions.
However, chasing 100% power is futile and expensive. As sample sizes grow, the gain in power diminishes. Adding the 100th subject adds far less confidence than adding the 10th. The sweet spot lies between 80% and 90%, balanced against the cost and feasibility of recruiting healthy volunteers.
Key Variables That Drive Sample Size Calculations
You cannot calculate sample size in a vacuum. It relies on four critical inputs. If you guess these wrong, your entire study design crumbles.
- Within-Subject Coefficient of Variation (CV%): This measures how much a single person’s response varies from one dose to another. High variability means you need more subjects to average out the noise. For example, a drug with a 20% CV might need 26 subjects, but if the CV jumps to 30%, you suddenly need 52 subjects-a doubling of cost and effort.
- Geometric Mean Ratio (GMR): This is the expected ratio of the test drug’s exposure to the reference drug’s. Most sponsors assume a GMR close to 1.0 (or 100%). However, assuming a perfect 1.00 ratio when the true ratio is 0.95 can increase the required sample size by over 30%. Conservative estimates here prevent surprises.
- Equivalence Limits: The standard range is 80-125%. Some agencies allow wider ranges for highly variable drugs or specific endpoints like Cmax (e.g., 75-133%), which can reduce sample size requirements by 15-20%.
- Significance Level (Alpha): Fixed at 0.05 by both FDA and EMA guidelines. This controls the Type I error rate-the risk of claiming equivalence when there is none.
The Variability Trap: Highly Variable Drugs
Some drugs are inherently unpredictable in the body. When the within-subject CV exceeds 30%, the drug is classified as highly variable. Under traditional rules, proving equivalence for these drugs could require over 100 subjects, making the study impractical.
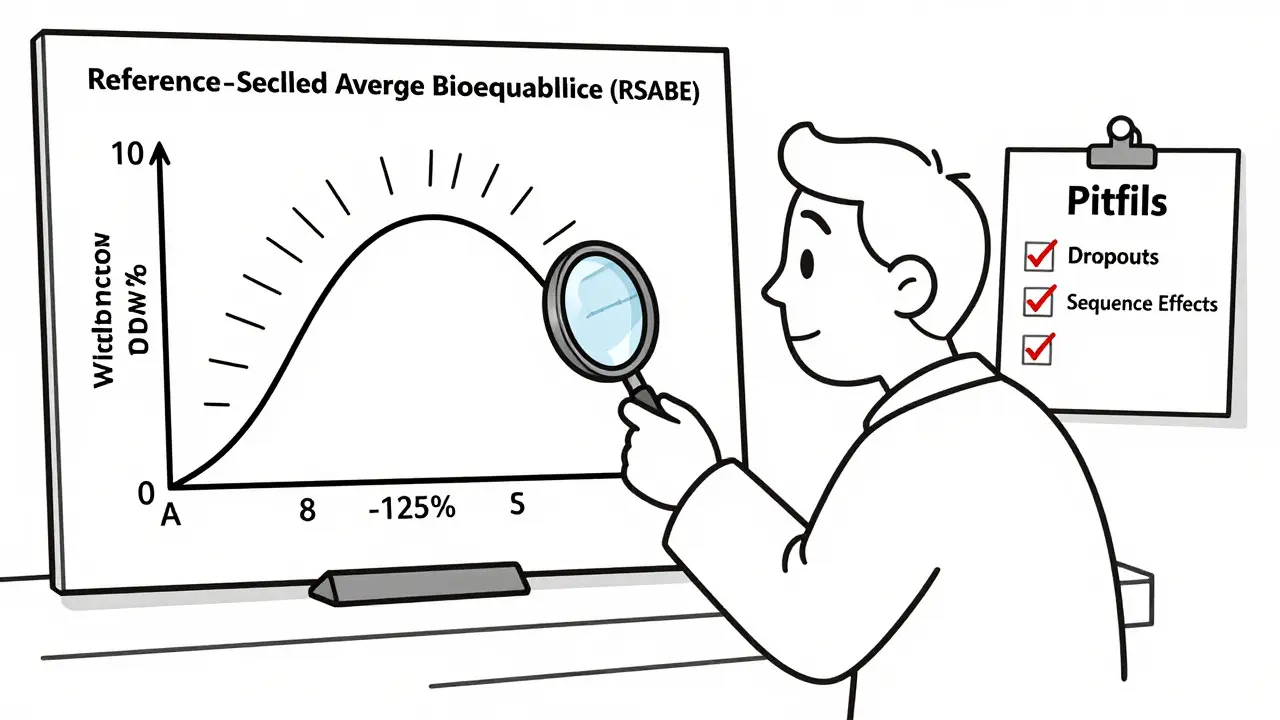
This is where Reference-Scaled Average Bioequivalence (RSABE) comes in. RSABE allows regulators to widen the acceptance limits based on the reference drug’s variability. Instead of a fixed 80-125% window, the limits expand slightly for very variable drugs. This adjustment can slash the required sample size from over 100 down to 24-48 subjects. The FDA and EMA both support RSABE, but the calculations are complex. You must use specialized software and follow strict regulatory templates to justify this approach.
| Drug Variability (CV%) | Assumed GMR | Target Power | Estimated Sample Size | Methodology |
|---|---|---|---|---|
| 20% | 95% | 80% | 26 subjects | Standard Average BE |
| 30% | 95% | 80% | 52 subjects | Standard Average BE |
| 35% | 95% | 80% | 24-48 subjects* | RSABE (Scaled) |
| 40% | 95% | 80% | 100+ subjects** | Standard Average BE (Impractical) |
Common Pitfalls in Power Analysis
Even experienced statisticians make mistakes in BE planning. Here are the most frequent errors that lead to rejected applications:
- Over-optimistic CV Estimates: Using literature values instead of pilot data is risky. The FDA found that literature-derived CVs underestimate true variability in 63% of cases. Always run a pilot study or add a buffer to your variability estimate.
- Ignoring Dropouts: People quit studies. They get sick, they forget appointments, or they fail compliance checks. Industry best practice is to add 10-15% to your calculated sample size to account for this. If you calculate 50 subjects, recruit 55.
- Focusing on One Endpoint: Bioequivalence requires passing on both AUC (total exposure) and Cmax (peak concentration). Many sponsors calculate power only for the more variable endpoint. The American Statistical Association recommends calculating joint power for both. Ignoring this can reduce your effective power by 5-10%.
- Sequence Effects: In crossover designs, the order in which subjects receive the test and reference drug matters. Failing to account for sequence effects led to rejections in 29% of EMA reviews in 2022. Ensure your statistical model includes sequence terms.
Tools and Software for Calculation
You shouldn’t do these calculations by hand. Specialized software handles the complex formulas, including log-transformation of pharmacokinetic data. Popular tools include PASS, nQuery, and FARTSSIE. PASS 15 is often cited as the most comprehensive for regulatory-aligned options. Free online calculators like ClinCalc can provide quick estimates, but for formal submission documents, validated commercial software is preferred. Remember to document the software name, version, and all input parameters in your protocol. The FDA flagged incomplete documentation in 18% of statistical deficiencies in 2021.
Regulatory Expectations: FDA vs. EMA
While the core principles are global, nuances exist. The FDA generally expects 90% power for narrow therapeutic index drugs, whereas the EMA may accept 80% in certain contexts. The EMA also permits wider acceptance ranges for Cmax (75-133%) in some cases, which can lower sample size needs. If you are submitting globally, design your study to meet the stricter of the two requirements to avoid having to run separate trials.
Next Steps for Your Study Design
To ensure your bioequivalence study succeeds, start with a robust pilot study to get accurate CV data. Use conservative assumptions for GMR. Add a 10-15% buffer for dropouts. And always verify your calculations with a biostatistician who specializes in BE. The cost of a consultant is negligible compared to the cost of a failed trial.
What is the standard sample size for a bioequivalence study?
There is no single standard number. It depends heavily on the drug's variability (CV%). For low-variability drugs (CV ~20%), 24-36 subjects are typical. For high-variability drugs (CV >30%), sample sizes can range from 48 to over 100 unless Reference-Scaled Average Bioequivalence (RSABE) methods are used, which can reduce this to 24-48 subjects.
Why is 90% power often preferred over 80%?
90% power provides a higher probability of demonstrating bioequivalence if the products are truly equivalent. While 80% is the minimum acceptable threshold, 90% reduces the risk of a Type II error (false negative). The FDA often expects 90% power, particularly for drugs with narrow therapeutic indices where safety margins are tight.
How do dropouts affect sample size calculations?
Dropouts reduce the final number of evaluable subjects, which lowers statistical power. To mitigate this, researchers typically inflate the initial sample size by 10-15%. For example, if calculations show 50 subjects are needed, you should recruit 55 to ensure at least 50 complete the study successfully.
What is RSABE and when is it used?
Reference-Scaled Average Bioequivalence (RSABE) is a statistical method used for highly variable drugs (within-subject CV >30%). It scales the equivalence limits based on the variability of the reference product, allowing for wider acceptance ranges. This significantly reduces the required sample size, making studies feasible without needing hundreds of participants.
Should I use literature values for CV% in my power analysis?
It is risky. The FDA has noted that literature-derived CVs often underestimate true variability. Best practice is to conduct a pilot study to obtain internal CV data. If using literature values, apply a conservative buffer (e.g., add 5-8 percentage points) to avoid underpowering the main study.
